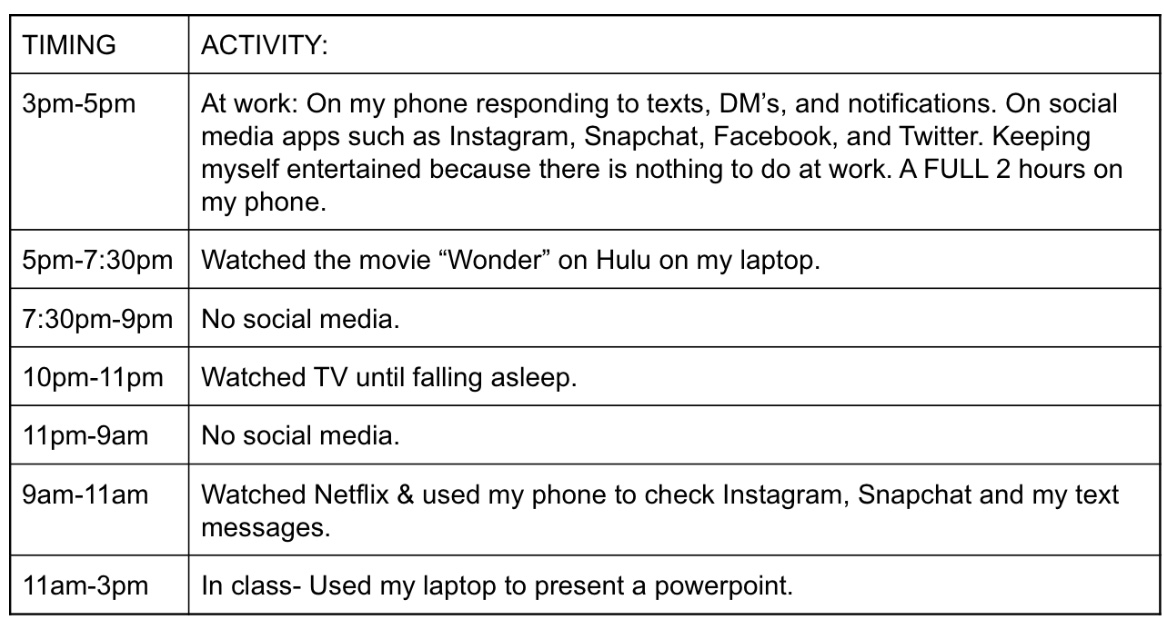
By logging my media use during a 24 hour period I observed that I spent about 10 hours a day using media. I used about five hours using social media apps and the other five hours watching television. Considering my days are usually routine this means I spend a total of 70 hours a week using media. I feel like this is not too bad for social media usage in today’s date. By making this chart I noticed I tend to spend a lot less time on social media than I did a few months ago. This is because I’ve made a conscious effort to use my phone less since November.
Although I have decreased my media usage in the past few months, I did still spend a total of 10 hours using media. I did not do any sharing on my social media apps during this 24 hour period, I just browsed. The only sharing I did on my phone was responding to text messages and phone calls. Socializing is what I did most while using my phone because all of the apps I used which were, Instagram, Snapchat, Facebook, and Twitter are made for virtual socializing. My communication and interaction happened mostly on my phone while I was texting my friends. But it also happened while I was on Facebook Instagram and Snapchat answering DM’s and Snapchats from friends and family.
My preliminary interpretations based on my observations of this data was that I was going to have significantly more social media usage than I did. This is because I feel like I spend more time on my phone than I actually do. I also was not expecting to log watching five hours of television, I thought it would have been less. Overall, I am not disappointed in my chart results and I think I am using social media in a healthier way now than I would have a few months ago. I think tracking what I use my social media for was also good to consider because it shows why we use the apps in the first place. Which is to be able to socialize whenever, wherever we are.